Anthropic has added Claude live dashboards and animated explainers. Claude Dashboards turns questions about connected business data into charts, while Claude Motion converts reports, charts, and product walkthroughs into editable animations that can be exported as MP4 files. Both tools are in beta, and access depends on the plan.
The update expands Claude beyond chat and static documents. It also builds on Anthropic’s broader push to make Claude a place to create and work with files, including the redesigned Claude Projects and its shared AI teammate for Slack.
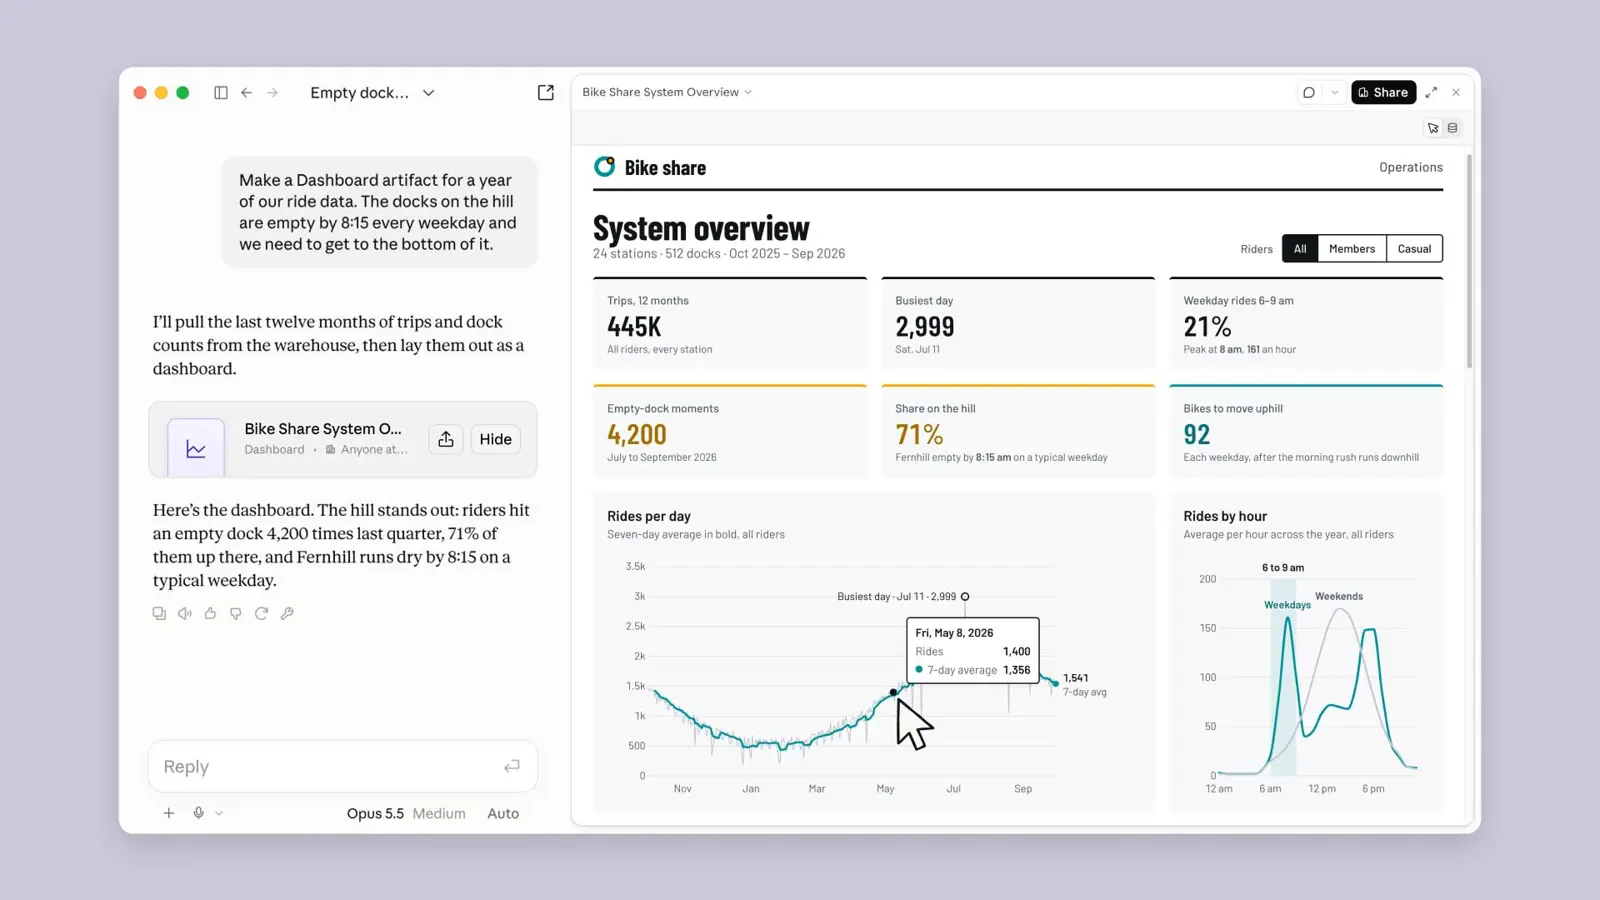
Claude Dashboards turns questions into charts
Users can connect Claude to data platforms such as BigQuery, Databricks, Snowflake, Amazon Redshift, and ClickHouse, or ask questions about information in connected apps such as Salesforce. A plain-language request can produce a dashboard for questions like how this week’s signups compare with last month.
Each chart shows the query used to produce it and when its data was last refreshed. That gives users a way to inspect how a number was calculated instead of relying only on the visual result. Anthropic says Dashboards is designed for quick, exploratory analysis and can hand work off to supported analytics tools for deeper investigation.
Claude Motion makes reports move
Claude Motion creates short animated explainers from a prompt. Anthropic’s examples include turning a quarterly report into a short presentation for an all-hands meeting, animating a chart for a board deck, or making a product walkthrough for customer onboarding.
The animations are built with code rather than generated video footage. Text, charts, shapes, images, and timing can be edited, either directly in the editor or by asking Claude to make a change. Finished animations can be downloaded as MP4 files.
This approach is different from text-to-video tools: Motion is intended to animate existing information and visual elements, not generate cinematic footage or AI-created people. It may suit teams that need to explain a report or product flow without rebuilding every element in a video editor.
Which Claude plans include the new tools?
Anthropic’s current help documentation lists Dashboards beta for Pro, Max, Team, and Enterprise plans. Motion beta is limited to Team and Enterprise. Enterprise administrators may need to enable the templates in organization settings before team members can use them.
The company has also moved Claude Docs, Slides, and Design out of beta and made those templates available across Claude plans, including Free. The newer Dashboards and Motion tools remain beta software, so availability and reliability may change.
A practical step beyond chat
Dashboards and Motion target two common tasks: finding a useful view of business data and explaining the result to other people. Query visibility and editable animations offer some transparency, but users should still check whether the data, calculations, and final presentation are correct before sharing them.
The new tools fit into Anthropic’s wider set of work features, including Claude in Chrome, Claude Science, and Claude Code’s iOS simulator workflow. Dashboards and Motion add more ways to produce a finished work product inside Claude, though both remain in beta.